


In the midst of a frightening global backdrop — ridden with energy supply disruption, soaring inflation and borrowing costs, high interest rates, two wars — Wall Street’s wider index S&P 500 trades just 2% away from a record high.
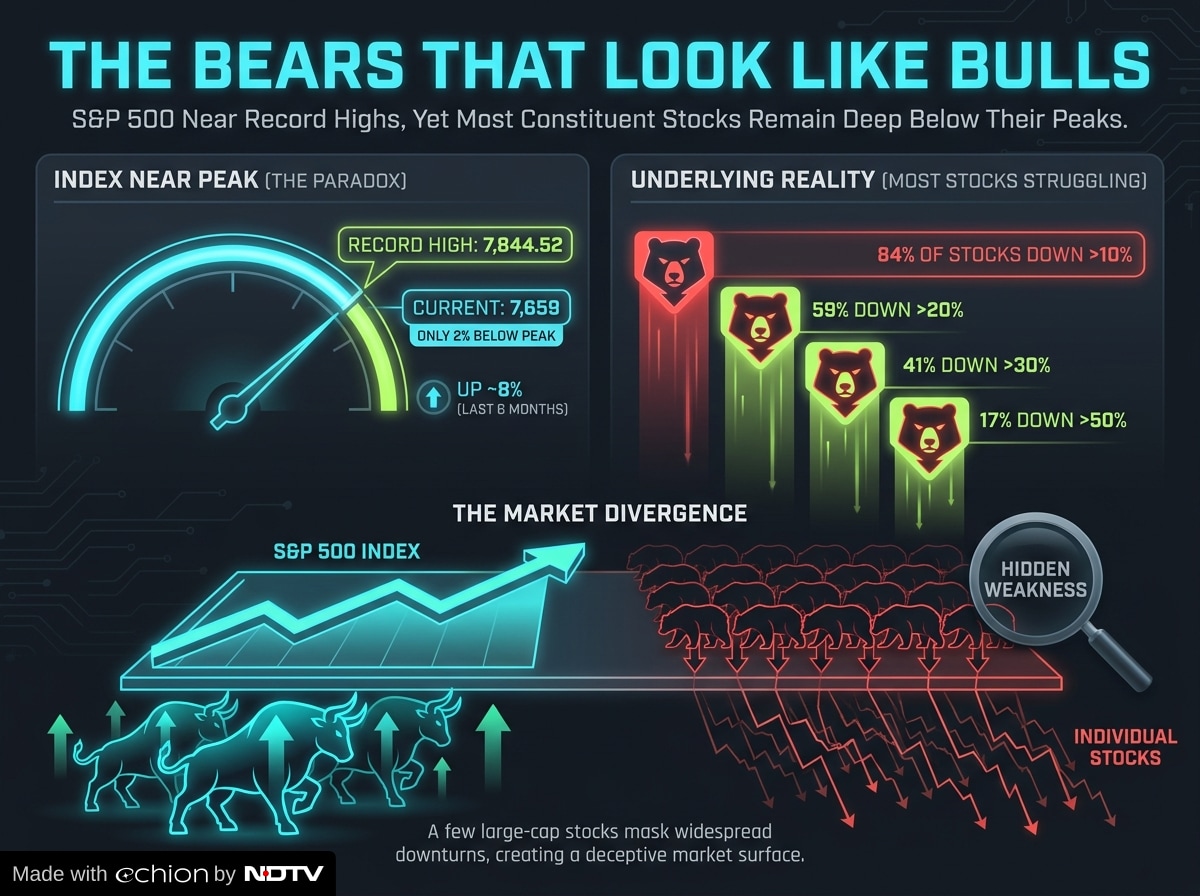
In the last six months, the index has gained nearly 8% even with escalations in the on-going US-Iran war. S&P 500 settled around 7,659 levels in the last trading session, only 2% lower than its Oct. 6 peak of 7,844.52.
Although, from the surface it may look like the S&P 500 is entering its fifth bull year, but a closer look might reveal the bears in its skeleton.
Also Read | Layoffs Are Rising In Tech, But These Skills Are Helping People Unlock Better Pay
Close to 84% of stocks in the broader index are down at least 10% from their peaks, led by the Real Estate sector, according to an analysis by the Kobeissi Letter.
Moreoever, 59% of S&P 500 stocks are down at least 20% from their highs, 41% are down more than 30%, and 17% are down more than 50%.
Who’s Driving The Returns?
Nvidia Corp., along with nine other tech stocks has contributed to 70% of the equity returns in the index. The Jensen Huang-led semiconductor giant is responsible for 13% of the total S&P 500 returns.
Followed by the other nine stocks, namely: Micron Technology Inc., Apple Inc., Microsoft Corp., Advanced Micro Devices Inc., Intel Corp., Amazon.com Inc., Broadcom Inc., and Meta Platforms Inc. Whereas the rest of the 490 stocks have contributed to only 30% of return on equities, the analysis highlighted.
Therefore, driving home the point that much of the benchmark index is a bear market.
Where Would S&P 500 Be Sans The Headwinds?
The Iran war triggered energy disruption ultimately led the Federal Reserve to hike key lending rates in September with more raises to follow going ahead; a sharp pivot from the central bank’s plan in the beginning of the year wherein it forecasted at least 3 rate cuts through 2026.
The US Federal Reserve raised its benchmark interest rate by 25 basis points to a target range of 3.75%–4% on September 16–17, 2026—its first rate hike since July 2023—driven by sticky inflation and hot September consumer price index (CPI) data.
S&P 500’s current growth is on par with levels during the second quarter of 2021 — when the American economy had revived from a historic lockdown and has a government pumped in stimulus worth $4 trillion.
Implying that, even in the thick of global energy crisis and a rate hike campaign, the growth is similar to the stimulus induced advance clocked back in 2021, the analysis underscored.
It said that the market’s resilience, coupled with AI trade momentum and strong earnings could have pushed S&P 500 above 9,000, in the absence of an Iran war.
Further, most of the big tech stocks have deep discounts priced-in to their stocks, even as they trade at or near record highs.
Nvidia’s price to earnings (P/E) ratio over the last 12 months is a testament to this claim, as per the analysis. Even with the stock being up more than 21% in one year, the company’s P/E ratio is down by 46%.
The stock now has a Forward P/E ratio of 24 times, only a little ahead of S&P 500’s 22 times, despite the share price having zoomed over 800% in the last five years.
Essential Business Intelligence,
Sharp Market Insights,
Practical Personal Finance Advice, Daily Fuel, Gold and Silver Prices and Latest Stories — On NDTV Profit.